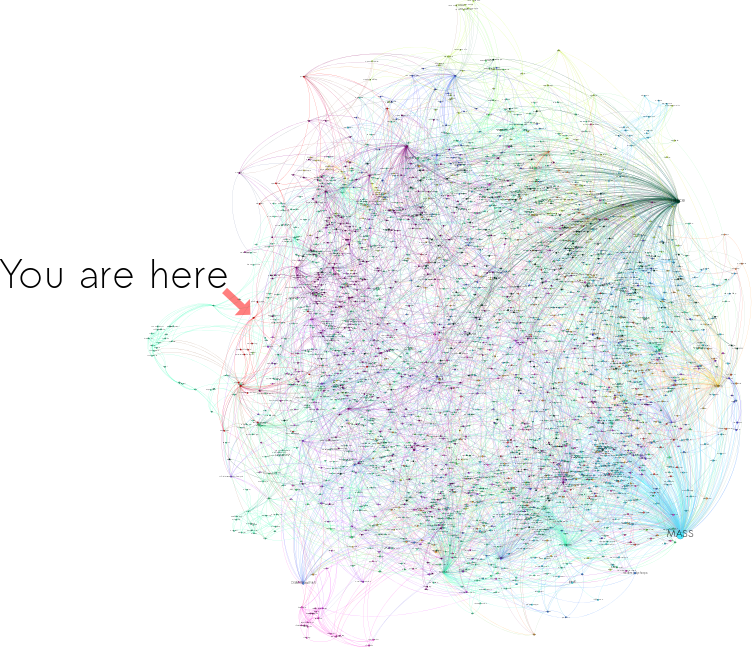
A Network Graph of CRAN package dependencies
Continuing on my recent project of making interactive network graphs (on projects where other brilliant people have already done the difficult querying), here's a visualization of the CRAN package dependencies. Sure, the philosophers graph is maybe more interesting, but this is a very real map of people power, too---and maybe as influential in these statistical times.
The absolutely artful data munging here comes from librestats. Check out his post!