American Beards Over Time: Time Series in R (Part I)
If you use R for time series analysis, chances are you've used Robert J. Hyndman's excellent forecast tools. I recently stumbled on his time series data library where I found just the data set I've been looking for to show some R time series plotting tricks:
http://robjhyndman.com/tsdldata/roberts/beards.dat
It's the percentage of American men with full beards reported annually. Nothing serious here, but absurdly perfect for a set of posts to share a couple things that took me a while to learn when plotting in R.
What you'll learn
- How to grab data from a plaintext source on the web, stripping header information
- How to convert a list of data with a known start time and end time into an xts time series object
- How to convert xts to a data.frame for plotting in ggplot2
- Aesthetics for red data points with dotted line interpolation
- How much American beardfulness there was in the late 19th century and early 20th.
The Data
So, there's an interesting history on this data set. In the demography section, the citation is listed as...
"Percent of Men with full beards, 1866 – 1911. Source: Hipel and Mcleod (1994)."
And inside the data set itself, a second cite reads:
# SEE MARIJA NORUSIS'S 1981 SPSS PRIMER FOR DETAILS AND
#ADDITIONAL DATA EXTENDING BACK TO 1842 AND FORWARD TO 1953
It turns out, both of these sources are drawing from an earlier study. I emailed with Marija Norusis who mentioned the source material was:
Robinson, D.E. Fashions in shaving and trimming of the beard: the men of the Illustrated London News, 1842-1972. American Journal of Sociology, 81:5 (1976), 1133-1141.
I'm told the AJS is actually a definitive journal, so whatever point is made here, this was likely kind of a big deal in 1976 sociology. I haven't been able to get digital access to AJS this far back, so if you have any additional information or the missing data forward to 1953, please let me know. This is one of those mundane-enough-to-be-crazy numbers no one should actually have, like how management consulting interviews ask you to estimate the number of rolls of toilet paper in the Empire State Building---similarly, I'd wager D.E. Robinson has an interesting methodology behind the scenes.
Anyway, let's take a look
Here's some code that will draw the data directly into your workspace and plot it:
library(XML)         # read.zoo
library(xts)         # our favorite time series
library(tis)         # recession shading.
library(ggplot2)     # artsy plotting
library(gridExtra)   # for adding a caption
library(timeDate)    # for our prediction at the end

# Get the data from the web as a zoo time series
URL <- 'http://robjhyndman.com/tsdldata/roberts/beards.dat'
beard <- read.zoo(URL,
    header=FALSE,
    index.column=0,
    skip=4, # removes header stuff
    FUN=function(x) as.Date(as.yearmon(x) + 1865))
# Last line is really tricky, check here to see why:
#http://stackoverflow.com/questions/10730685/possible-to-use-read-zoo-to-read-an-unindexed-time-series-from-html-in-r/10730827#10730827

# Put it into xts, which is a more handsome time series format than zoo.
beardxts <- as.xts(beard)
names(beardxts) <- "Full Beard"

head(beardxts) # take a peek for yourself.

# Make into a data frame, for ggplotting
beard.df <- data.frame(
    date=as.Date(index(beardxts),format="%Y"),
    beard=as.numeric(beardxts$'Full Beard'))

# Make the plot object
bplot <- ggplot(beard.df, aes(x=date, y=beard)) +
    theme_bw() +
    geom_point(aes(y = beard), colour="red", size=2) +
    ylim(c(0,100)) +
    geom_line(aes(y=beard), size=0.5, linetype=2) +
    xlab("Year") +
    ylab("Beardfulness (%)") +
    opts(title="Percentage of American Men Fully Bearded")

#Plot it
print(bplot)
Beautiful Results
That should give you the following plot:
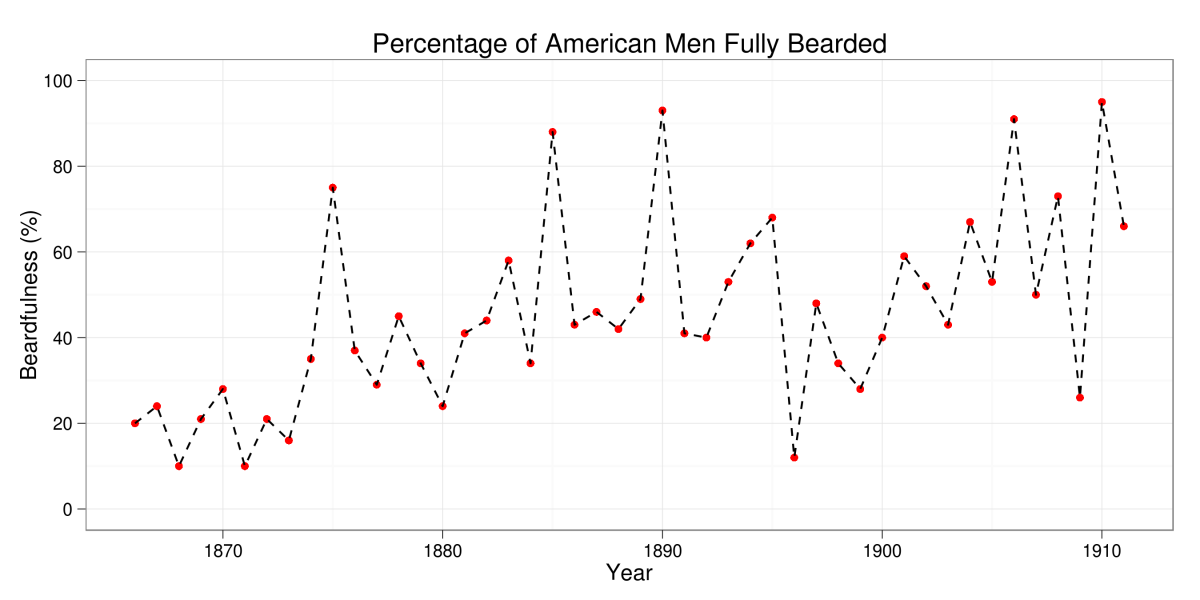
Reflections
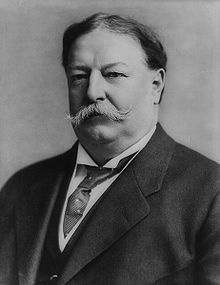
- I don't know about you, but I'm curious about the peak in 1890---traditionally "The Closing of the American West"---and in 1910. As a point of reference, President William Taft (1908-1912) had a large Hungarian-style mustache, but not a complete beard.
- Did I mess anything up? Leave improvements in the comments!
Next up...
Check out Part II to learn about how to plot recession shading.