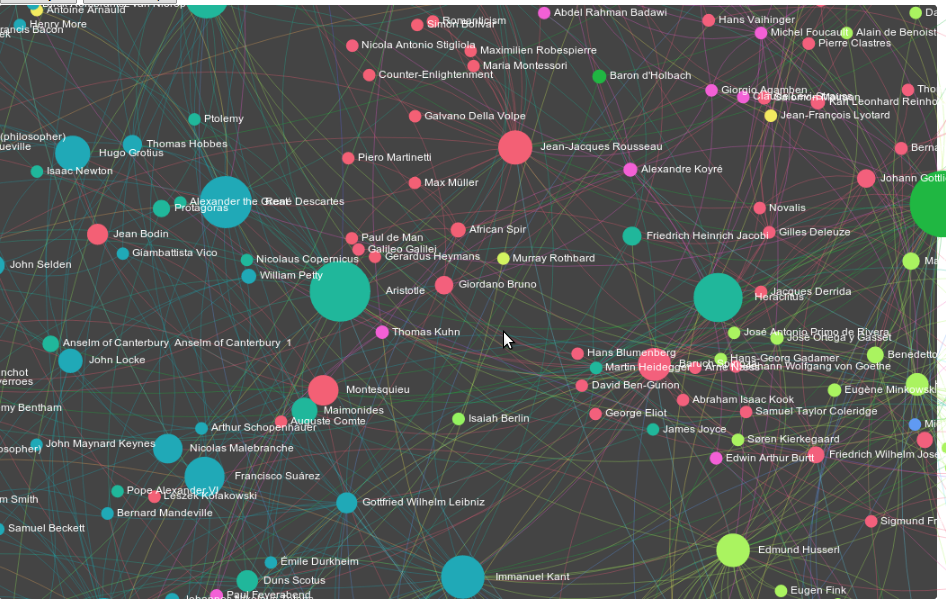
Resuming from last time, I've made some updates to the philosophers' social network including publishing two interactive maps. Quick introduction: you know that sidebar on wikipedia where it tells you someone was influenced by someone else, linking to them? These graphs are generated from asking wikipedia for a comprehensive list of every philosopher's influence on every other. There are some sample-bias issues and data problems I went over in the first part of the series, but overall it's both beautiful and interesting.